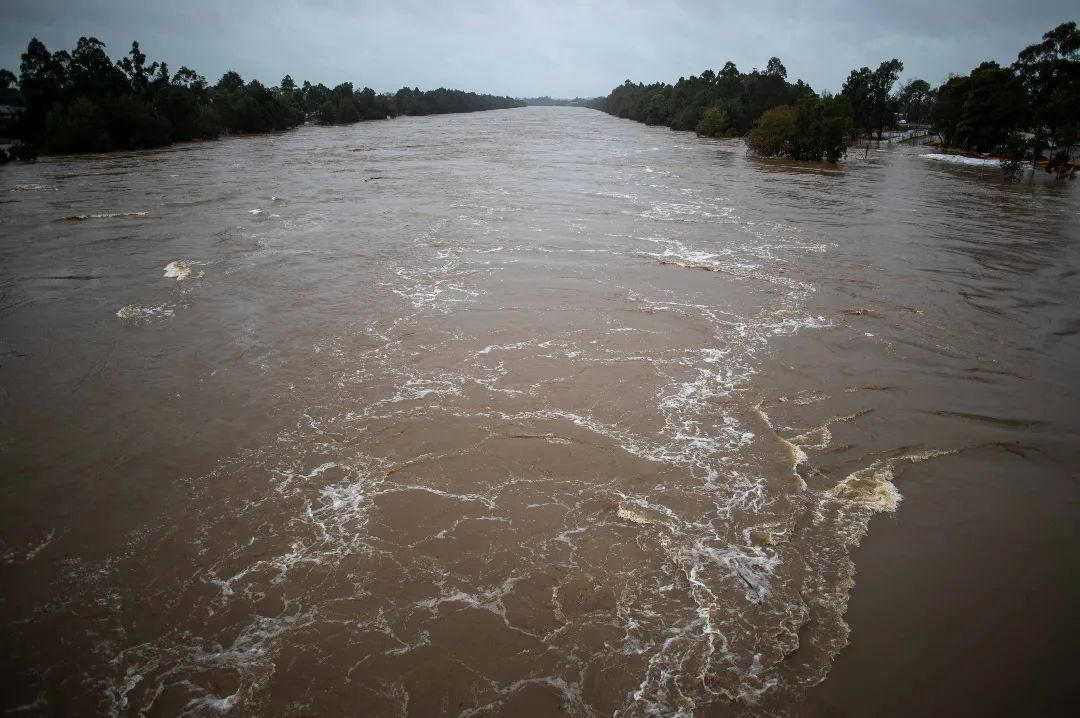
Parts of Australia’s east coast just endured their wettest first half of a year on record, which has this week culminated in the third major flood event of the year in central eastern NSW. But what has made 2022 so much wetter than every other year in recorded history for parts of eastern Australia?
Back-to-back La Niña events
The start of 2022 was always expected to be wetter than average in eastern Australia because of La Niña. This Pacific Ocean climate driver, which occurs on average around once or twice per decade, is known to boost rainfall over northern and eastern Australia.
This year started under the influence of the first back-to-back La Niña event in a decade. The first of these La Niña episodes occurred between September 2020 and March 2021, and this was followed by a second La Niña from November 2021 to June 2022.
Both of these La Niña episodes caused above average rain over large areas of eastern Australia during the first half of the year.


Images: Observed rainfall deciles during the first six months of 2021 (top) and 2022 (bottom). Source: Bureau of Meteorology.
However, while both maps show that January-to-June rainfall was above average for most of NSW, 2022 was far wetter in eastern NSW and southeast QLD.
The contrast between the first half of 2021 and 2022 is highlighted further in the map below, which shows the difference in observed between these two periods.

Image: Australian rainfall difference for 6 months: January to June 2022 –2021. Source: Bureau of Meteorology.
As you see on the map above, parts of southeast QLD, northeast NSW and central eastern NSW have seen over 400mm more rain in the first 6 months of this year than the same period last year. Amazingly, a few places have even managed to pick up over a metre more rain in the first half of this year than last year.
The above average rain during the first six months of 2022 has also been topped off by a very wet start to July. The map below shows that the first 6 days of July 2022 produced about four months’ worth of rain in parts of central NSW, the NT and QLD.

Image: Rainfall percentages during the first 7 days of July 2022. Source: Bureau of Meteorology
There is no doubt that La Niña helped make the start of 2022 wetter than average. However, it wasn’t the only climate driver influencing Australia’s weather over the last six months.
Multiple wet-phase climate drivers
In addition to La Niña, several other broad-scale climate drivers helped produce above-average rainfall over eastern Australia during the last six months.
The Southern Annular Mode (SAM) has been in a predominantly positive phase so far this year, which means cold fronts have been displaced to the south, and easterly winds have been more prevalent than usual over large parts of eastern Australia.
These easterly winds have reinforced La Niña by boosting the flow moisture-laden air over eastern Australia. The graph below shows that the SAM was mostly positive during the first six months of both 2022 and 2021.

Image: Southern Annular Mode (SAM) index values between January 1 and July 4 in 2021 and 2022.
It is worth pointing out that the brief spell of negative SAM during June 2022 corresponded with a break in the rain, with NSW registering its driest June since 1986. However, this was short-lived and the rain has returned in the opening week of July.
We have also seen a negative Indian Ocean Dipole (IOD) pattern starting to emerge to the northwest of Australia over the last few weeks. This developing negative IOD has helped drive moisture towards Australia from the Indian Ocean, which typically boosts rainfall in southeastern Australia, particularly on and west of the Great Dividing Range. The IOD was also in a negative phase during the middle of 2021.
What made 2022 different?
The first halves of 2021 and 2022 were both influenced by La Niña, a predominantly positive SAM and a developing negative IOD pattern. However, there were some key differences that have made 2022 much wetter:
- La Niña persisted until June in 2022, which is a few months later than average and three months beyond the end of the 2020/21 La Niña event. This lingering La Niña phase prolonged the above-average rainfall in eastern Australia.
- Much of the landscape, dams and rivers in eastern Australia were full of water at the beginning of 2022 thanks to the ongoing influence of back-to-back La Niña events. This meant the environment was primed for flooding before the prolific rain of 2022 even started.
- Sea surface temperatures over the Tasman Sea have been exceptionally warm this year. This started with a record-challenging marine heatwave in January and at the start of July, there is still a pool of water sitting off the NSW coast that is about 2 to 3C warmer than average. This abnormally warm water has enhanced evaporation and provided an extra source of moisture for rain-bearing systems passing over NSW.

Image: Sea surface temperature anomalies on July 5, 2022. Source: Bureau of Meteorology
4. The first half of 2022 also saw several East Coast Lows and frequent low pressure troughs over eastern Australia. These lows and troughs converted the abundant atmospheric moisture into rainfall over vast areas of NSW and QLD. The map below shows the mean sea level pressure anomaly during the first half of 2022, with below-average surface pressure in eastern Australia.

Image: Surface air pressure anomaly for the six-month period from January 2021 to June 2022. Source: NOAA
Australia’s weather has been influenced by several wet-phase climate drivers over the last two years, including La Niña, a predominantly positive SAM, and negative IOD. However in 2022, these broad-scale climate drivers were supported by local weather patterns and warm seas that were conducive to driving heavy rain into Australia’s east coast. This has resulted in the wettest start to year on record for some areas of eastern NSW and southeast QLD.
Weatherzone conducts detailed seasonal forecasts which can help with long-term planning out to six months. The seasonal forecasts are tailored to the business and can include risk of heavy rainfall and flood risk, tropical cyclones, thunderstorms, extreme heat, bushfires and much more. These forecasts can be delivered live online or face to face, allowing time for questions and increasing engagement. For more information on our products or how we can help you with your business needs, please contact us at business@weatherzone.com.au.