Sydney endured its second wettest June day on record on the weekend as a bombing low pressure system rapidly intensified off the NSW coast.
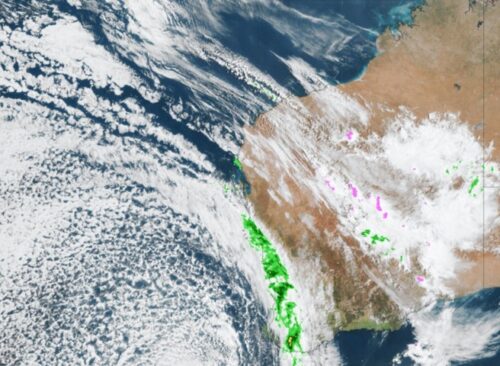
The radar animation below shows heavy and persistent rain hammering central eastern NSW on the weekend.
#Sydney‘s 142.6mm during the last 24 hours was the city’s heaviest daily rain in 4 years and its wettest June day since 1991. It’s also more than one month’s rain for this time of year. Sydney’s June monthly average is about 132mm. pic.twitter.com/HxDXg762PR
— Ben Domensino (@Ben_Domensino) June 1, 2024
Sydney was inundated by heavy rain on Saturday into Sunday morning, with the Observatory Hill weather station collecting 142.6 mm of during the 24 hours ending at 9am on Sunday. This was more than the city’s entire June average (about 132 mm) and Sydney’s second wettest June day in records dating back to 1859, beaten only by 150.6 mm in 1991.
The weekend’s torrential rain, which caused flash flooding in parts of Sydney, was driven by a rapidly deepening low pressure system over the Tasman Sea.
The low formed on Saturday and intensified so quickly that its central pressure dropped by 19 hPa during the 24 hours ending at 4pm on Sunday. At Sydney’s latitude, this rate of pressure change was enough to classify the system as a ‘bombing low’, which is the name given to mid-latitude low pressure system that deepens rapidly in a process called explosive bombogenesis.


Images: Mean sea level pressure (MSLP) analysis charts from 4pm AEST Saturday, June 1 (top) and 4pm AEST Sunday, June 2 (bottom), showing a deepening low pressure system over the Tasman Sea. Source: Bureau of Meteorology
The threshold for a bombing low pressure system differs depending on latitude. For example, at 60° latitude in either hemisphere, a pressure drop of 24 hPa in 24 hours is required a system to be classifies as a bombing low. But at Sydney’s latitude around -34° south, a system’s central pressure only needs to drop by around 16 hPa in 24 hours for it to be a bombing low. This made the weekend’s 19 hPa pressure drop more than enough to call the Tasman Sea system a bombing low.
Other impacts from the weekend’s bombing low in the Tasman Sea included:
- Maximum wave heights reaching 9.6 metres off Sydney at midday on Sunday
- Mallacoota’s 112 mm of rain during the 24 hours ending at 9am on Monday was its wettest winter day on record, with data dating back to the 1970s
This was the second bombing low pressure system near Australia in one week, after another low deepened by 30 hPa in 24 hours over the Great Australian Bight last Wednesday and Thursday.
Abnormally warm sea surface temperatures near Australia southern and eastern coastlines may have helped these two low pressure systems undergo bombogenesis.