Summer and winter are both challenging seasons for those in the electrical market, but which increases energy demand the most?
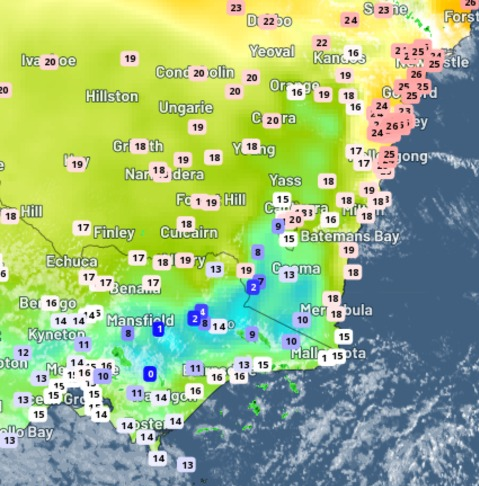
Heatwaves and cool spells both place a significant strain on the electricity system in Australia, with either the heating or cooling of homes and businesses.
Extremely hot or cool temperatures can also impair key electrical infrastructure playing a part in electricity outages in both summer and winter.
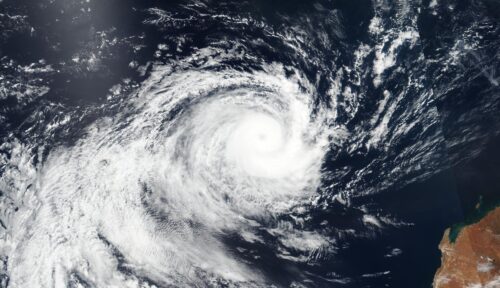
Heat, bushfires, drought, extremely cold temperatures and severe storms can all disrupt and destroy electricity networks.
Summer
Heatwaves and extreme temperatures can drive high energy demand across parts of Australia through increased air conditioner use during summer. They have the greatest impact on the network when they impact multiple states at the same time, particularly when affecting SA and VIC. Some other common summer impacts are:
- High temperatures impair the operation of key electrical infrastructure. This can be compounded by high energy demand that often occurs at the same time.
- Generators, power lines, transformers and other electrical equipment can underperform or fail when temperatures get too hot. Renewable energy infrastructure is also impacted by the heat with solar panels and wind turbines underperforming.
- During summer, raging bushfires often threaten the electricity network and transmission lines. The black summer bushfires during 2019 and 2020 damaged power lines and caused widespread power outages that impacted tens of thousands of households in Australia’s southeast.
- Dust storms in summer can cause sparking between lines initiating more fires and line failures.
Winter
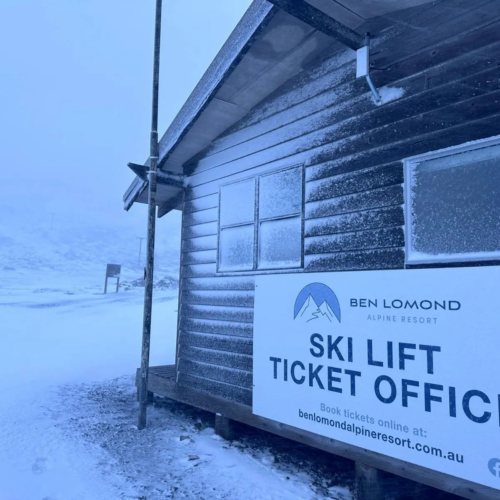
Cool temperatures can also increase energy demand with increased heater use in homes and businesses. Key electrical infrastructure also underperforms when temperatures get too cold, however this occurs more often in extreme heat. Strong winter winds and fallen trees can damage the transmission lines during the cooler months, causing black outs or outages.
Cold spells this winter may be exacerbated by high coal prices, plant outages and a reduction in renewable energy such as solar in winter. Already during the first days of this winter we have seen a prolonged cold spell in Sydney and Melbourne caused gas prices to jump to more than 50 times normal levels.
Does energy demand peak in summer or winter?
According to the Australian Energy Market Operator, maximum operational demand occurs in summer, driven by cooling load across most of Australia’s states and territories. However, Tasmania’s peak demand occurs in winter which is driven by heavy heater use.
The image below shows that the highest demand occurred in January (summer) rather than July (winter) during each of the past ten years.

Image: Highest energy demand (MW) in Victoria during the past 10 years in January and July. Source: AEMO’s Aggregated Price and Demand Data – Historical
Australia’s warming climate will continue to increase demand and impact key infrastructure in the future.
In AEMO’s 2019 summer readiness report, they stated that weather forecasts are “now the most important input into forecasting of demand and supply of generation for the National Energy Market (NEM)”.
How can Weatherzone help?
Weatherzone’s trusted nowcasting and forecasting system, OpticastTM, is independently proven to outperform other industry models, allowing energy traders to respond rapidly to changing conditions. From 14 day forecasting to seasonal outlooks, you have access to complete and powerful weather intelligence giving you the confidence to make the best call.
Meeting the needs of the changing market, Weatherzone utilises high-resolution modelling and local knowledge to provide 5-min granularity observations and forecasts, optimising your market bidding and maximising your profits. These, coupled with briefings from our energy meteorologists, give you full awareness of the associated risk.
Benefit from specialised indices such as apparent temperature, Cooling/Heating Degree Days (CDD/HDD) and Effective Degree Days (EDD) to help accurately predict demand. You can get a clear picture of forecast conditions across the market and quickly assess heat/heatwave potential from 14 days out to 12 months
No matter where your energy trading focus lies, we have the power generation and weather insights to inform your critical decisions – keeping you ahead of the curve.
For more information, please contact us at business@weatherzone.com.au.